The AURA Metrics for Agentic Development
When we rolled out the enterprise DevOps platform at a large financial services company, we tracked four numbers religiously. We watched deployment frequency, lead time, change failure rate, and mean time to recovery. We had 4,000 engineers, 2,000 applications, and a pipeline that had gone from 180-day deployment cycles to 14 days. Those four metrics told us whether the platform was working. They told leadership where to invest. They told engineering teams where to improve. We were measuring DORA (DevOps Research and Assessment) metrics before the DORA research program gave them that name.
Then agents entered the picture.
The numbers still moved. Deployment frequency kept climbing. Lead time kept shrinking. But the metrics stopped answering the questions that mattered. "How much of this output is agent-generated versus human-generated?" No answer. "Is agent-generated code as reliable as what developers write directly?" No answer. "Are we just doing the same work faster, or are teams tackling work they never would have attempted?" No answer.
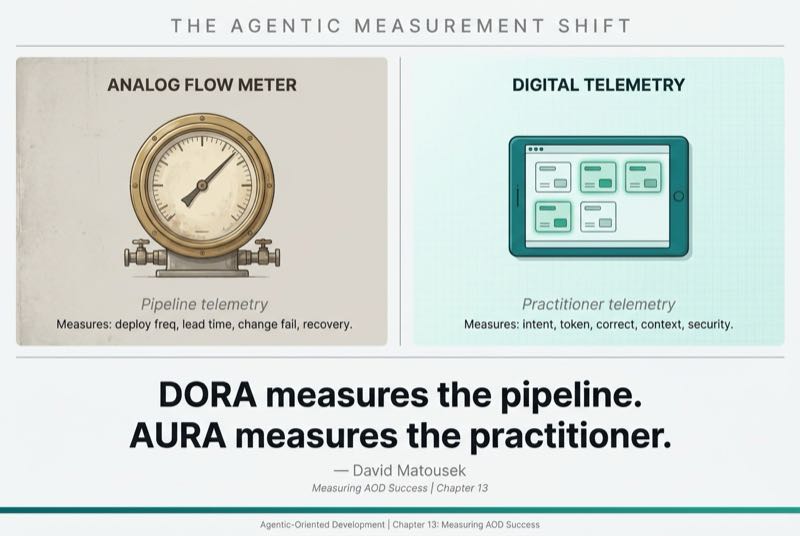
DORA metrics were built for the pipeline. They measure how quickly and reliably code moves from commit to production. That was the right question for DevOps. It's not the right question for agentic development.
Agentic development needs its own measurement language. I call it AURA, short for Agentic Utilization and Reliability Assessment. Five metrics designed to measure what DORA cannot. Not replacements. Additions.
DORA measures the pipeline. AURA measures the practitioner.
Why Story Points and Velocity Break
Existing software metrics assume human-paced work with predictable decomposition. Agents break those assumptions.
Story points measure estimated human effort. When an agent completes a "5-point story" in 20 seconds, the metric loses all signal. Was that efficient? Was it correct? The number can't tell you.
Velocity assumes stable team capacity from sprint to sprint. Agent capacity fluctuates based on context window management, tool availability, and model capability changes. A model update on Tuesday can make Wednesday's team radically different from Monday's. Velocity comparisons across sprints become meaningless.
Lines of code, commit frequency, pull request throughput. All become noise when agents can generate massive volumes that may or may not be useful. Output volume is not output value.
The measurement vacuum is real. Teams adopting agents without new metrics know things feel faster. They can't prove it, quantify it, or reproduce it. The Agentic Maturity Model from Chapter 6 shows the progression from vibe coder to agentic engineer. If you can't measure where you are on that journey, you can't track whether you're advancing or plateauing.
The AURA Framework
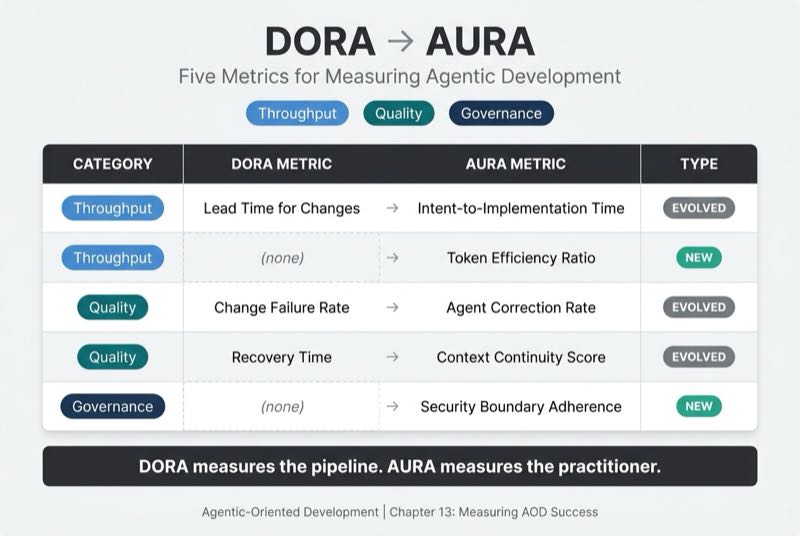
AURA consists of five metrics organized into three categories. DORA splits its metrics into throughput (deployment frequency, lead time) and stability (change failure rate, recovery time). DORA's model has evolved since those original four metrics, and the 2025 report moved from performance tiers to team archetypes. AURA uses the original four-metric model as a teaching baseline because the throughput-versus-stability split remains the most widely understood framing.
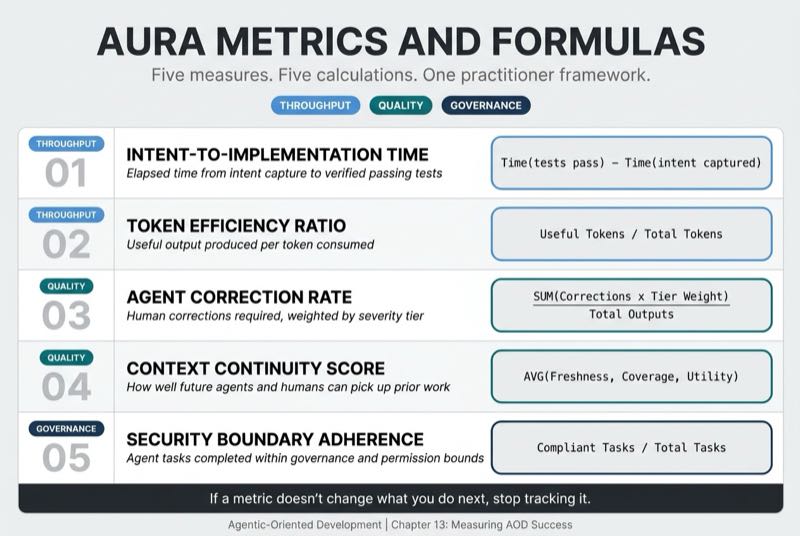
AURA splits into throughput (Intent-to-Implementation Time, Token Efficiency Ratio), quality (Agent Correction Rate, Context Continuity Score), and governance (Security Boundary Adherence).
| Category | DORA Metric | AURA Metric | Relationship |
|---|---|---|---|
| Throughput | Lead Time for Changes | Intent-to-Implementation Time | Evolved |
| Throughput | (none) | Token Efficiency Ratio | New |
| Quality | Change Failure Rate | Agent Correction Rate | Evolved |
| Quality | Recovery Time (Reliability) | Context Continuity Score | Evolved |
| Governance | (none) | Security Boundary Adherence | New |
One principle governs all five. If a metric doesn't change what you do next, it isn't worth tracking. Every AURA metric informs a decision. Vanity metrics aren't the goal.
Metric 1: Intent-to-Implementation Time
DORA's lead time measures commit-to-deploy. Intent-to-Implementation moves both boundaries.
Intent-to-Implementation Time is the time from expressing a capability intent, whether in natural language or a formal spec, to verified, working code in the target environment.
The starting point moves earlier (from commit to intent) and the endpoint moves later (from deploy to verified working). It captures the full loop, including spec creation, agent delegation, and test verification. An agent that ships code in 30 seconds but requires four hours of human correction has poor Intent-to-Implementation Time. The raw speed is irrelevant if the output isn't usable.
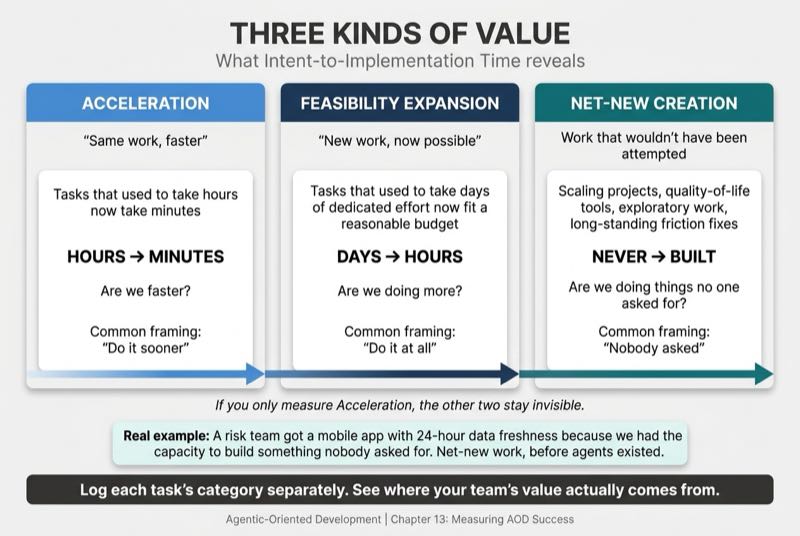
What makes this metric powerful is the three categories it reveals:
Acceleration is same work, faster. Tasks that used to take hours now take minutes. This is what most people think of when they think about AI productivity.
Feasibility expansion is new work, now possible. Tasks that used to take days of dedicated effort now fit within a reasonable time budget. They were technically possible before but practically infeasible given other priorities.
Net-new creation is work that would not have been attempted at all.
A meaningful share of AI-assisted work consists of tasks that would not have been done otherwise. That means scaling projects, building quality-of-life tools, doing exploratory work, and fixing long-standing friction points. If you only measure acceleration, that entire category of value stays invisible.
I have seen this pattern before agents existed. At a large investment firm, a Chief Risk Officer told me his team of 20 analysts waited 30 days for risk data compiled on an Access database running under someone's desk.
My team built a mobile app with a cloud-native backend that delivered 24-hour data freshness. Nobody had asked for it. The existing process was "good enough" for years. We built it because we had the capacity and the capability to see the opportunity. That is net-new work. Intent-to-Implementation Time should track all three categories separately so you can see the full picture.
Practical measurement: Track the elapsed time from initial intent capture (spec file creation or natural language request) to verified passing tests. Log each task's category (acceleration, feasibility expansion, or net-new) to see where your team's value is actually coming from.
Metric 2: Token Efficiency Ratio
Speed tells you how fast you're going. It says nothing about whether you're spending wisely to get there.
Unlike the previous metric, Token Efficiency has no DORA counterpart. It's entirely new to agentic development, because the resource it measures, tokens (the discrete units of text that AI models process, and that organizations pay for per use), didn't exist as a development cost before.
Token Efficiency Ratio measures useful output per token consumed across a session.
A context window (the total amount of information an AI model can hold in working memory at one time) has hard limits. Token economics are real costs. An agent that burns 100,000 tokens to produce 10 lines of useful code has a materially different efficiency profile than one that produces 500 lines from the same budget. Token Efficiency makes that difference visible.
I watched two practitioners work through an API integration on the same codebase last month. One structured the context cleanly, loading only the relevant service interfaces and the target schema. She got three productive tasks completed in a single session. The other loaded the full project tree and every test file. He burned through his context window on a single task before the model started generating references to functions that didn't exist. Same model, same tools, same problem. The difference was context architecture.
Three factors drive this metric:
Context pollution cost (the drag created when irrelevant information crowds out high-value context) measures how much of the token budget goes to irrelevant information. Chapter 2 described context pollution as the memory leak of agentic systems. Token Efficiency Ratio makes that cost visible in dollars and in wasted capacity.
Retry waste captures how many tokens are spent on failed attempts. A poorly structured prompt that requires three rounds of correction burns three times the tokens for the same result.
Context window utilization tracks how many productive tasks fit in one session before quality degrades. Some practitioners get eight productive tasks per session. Others get two. The difference is context architecture, and Token Efficiency measures it.
For enterprise teams running hundreds of agent sessions daily, the difference between 80% and 95% token efficiency is significant. This metric makes the cost of bad context hygiene concrete.
Practical measurement: Tasks completed divided by tokens consumed per session. Trend over time. Benchmark across team members. One caveat: task granularity must be consistent. An agent that breaks one large task into ten sub-tasks looks ten times more efficient on paper. Normalize by defining what counts as a "task" at the intent level, not the execution level.
Metric 3: Agent Correction Rate
Efficiency without accuracy is just expensive failure. Knowing how fast and how cheaply you produce output means nothing if that output needs constant fixing.
Not all failures are equal. That's the core problem with DORA's change failure rate, which treats a config typo and a data exfiltration vulnerability as the same "one failure." Agent Correction Rate fixes this with severity tiers.
Agent Correction Rate is the percentage of agent outputs requiring human correction, weighted by severity.
Tier 1 (Cosmetic): Formatting, style, naming conventions. Low weight. These corrections take seconds.
Tier 2 (Functional): Logic errors, incomplete implementations, missed edge cases. Medium weight. These require understanding the intent and fixing the gap.
Tier 3 (Architectural): Design decisions that create technical debt or violate system constraints. High weight. These corrections may require restructuring entire implementations.
Tier 4 (Security/Safety): Permission violations, data exposure, boundary breaches. Maximum weight. These corrections are non-negotiable and indicate a trust failure.
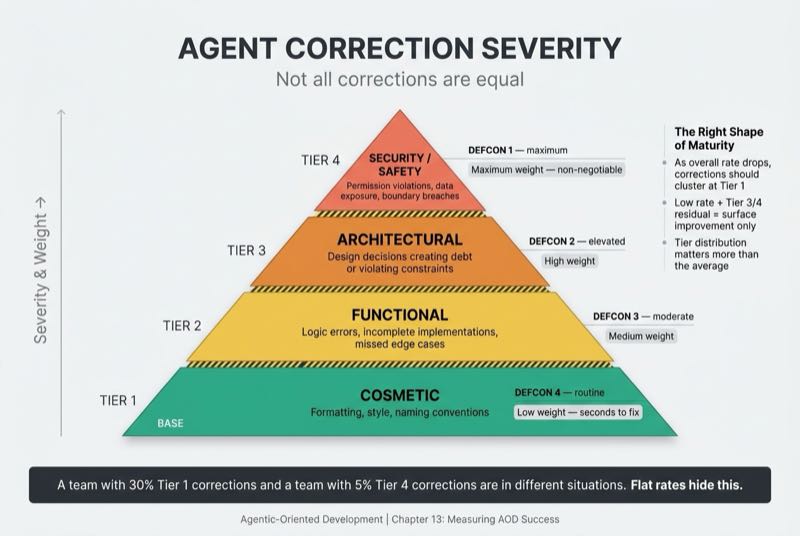
Why do severity tiers matter? A team with a 30% correction rate where all corrections are Tier 1 is in a fundamentally different position than a team with a 5% correction rate where the remaining corrections are all Tier 4. Flat correction rates hide this distinction completely. You need to know not just how often agents fail, but how badly.
I watched a platform team discover that just three failure types accounted for 60% of all agent corrections. Most were Tier 2 (functional) errors on the same class of API integration. They didn't try to improve everything at once. They fixed those three, and the entire correction rate dropped. That is what severity tiers enable. You stop treating every failure as equal and start targeting the ones that actually hurt.
There's a pattern to watch for as teams mature. As overall correction rates drop, the remaining corrections should cluster increasingly at Tier 1 (cosmetic). If your correction rate is low but the remaining corrections are Tier 3 and 4, your agents are getting better at easy things and still failing at hard things. That looks like improvement on the surface. It is not.
This maps to DORA's Change Failure Rate, but with a critical upgrade. Chapter 9's multi-dimensional scorecards separated failure modes for individual evals. Agent Correction Rate aggregates those same dimensions into an organizational metric. The eval architecture (Chapter 9) is where you diagnose. AURA is where you measure the trend.
Practical measurement: Log every human correction to agent output with a severity tier tag (1-4). Calculate the weighted correction rate per sprint. Track tier distribution shifts over time, not just the overall number.
Metric 4: Context Continuity Score
What happens when a practitioner leaves a project on Friday and a new team member picks it up on Monday? If the answer is "they spend the first two days reconstructing context that already existed somewhere," you have a Context Continuity problem. I watched exactly this happen on a team that had built a solid microservices layer but never updated the service specs. A new engineer spent three days reconstructing integration patterns that the original team had already solved and documented nowhere.
Context Continuity Score measures how well future agents and humans can understand, adopt, and extend work done in previous sessions or by other practitioners.
This isn't about uptime. It isn't about availability. It measures knowledge persistence across boundaries. Can the next person, or the next agent, pick up where you left off without paying a "context reconstruction tax"?
The parallel to DORA's Recovery Time is conceptual rather than direct. Both measure resilience, but Context Continuity addresses knowledge persistence rather than service restoration.
The Three-Layer Memory Model from Chapter 11 (Context, Project Knowledge, Practitioner Knowledge) and the Knowledge Loop that makes the Agentic Development Lifecycle (ADLC) sustainable provide the architecture. Context Continuity Score measures whether that architecture is actually working. The model is the design. This metric is the health check.
Three components:
Knowledge freshness. Are artifacts current? A component updated within the last 30 days scores high. One untouched for 90 days scores low. Stale specs are worse than no specs because they create false confidence. An agent loading a six-month-old architecture document will make decisions based on a system that no longer exists.
Knowledge coverage. Do all major components have knowledge artifacts? Gaps force context reconstruction. If three out of five services have up-to-date specs and the other two have nothing, every agent working on those two services starts from scratch.
Knowledge utility. Do agents actually load and use the artifacts? An artifact nobody reads has zero continuity value. This dimension prevents the trap of creating documentation for documentation's sake. Measure it by logging agent context loads per session and tracking which artifacts are referenced versus which sit untouched. If a spec exists but no agent has loaded it in 30 days, it has a utility problem.
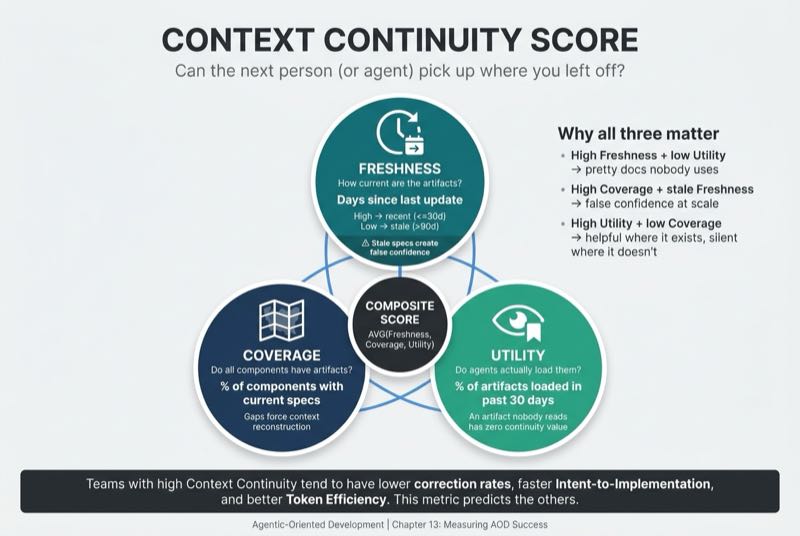
Teams with high Context Continuity Scores tend to perform better on every other AURA metric. Agents start faster, make fewer errors, and burn fewer tokens on re-discovery. As agent systems scale, spec freshness, rule accumulation rate, and context load per session become the levers. Chapter 4's 200-line rule for base context is the foundational constraint. Context Continuity Score tells you whether you're staying within it across your entire knowledge base.
Practical measurement: Score each major component on freshness (days since last update), coverage (percentage of components with current specs), and utility (percentage of artifacts loaded by agents in the past 30 days). Average across the three dimensions for a composite score.
Metric 5: Security Boundary Adherence
The first four metrics tell you whether your agents are fast, efficient, accurate, and building on persistent knowledge. None of them tell you whether your agents are staying inside the lines.
DORA has no equivalent for this metric, and that gap tells you something about how security has been treated in development measurement. The usual measures are incident count, vulnerability density, and compliance percentage. None of these tell you whether your agents are operating within their intended boundaries in real time.
Security Boundary Adherence is the percentage of agent tasks completed strictly within granted governance and permission parameters. It makes trust measurable.
I learned what continuous security measurement looks like when I built a cloud security capability at a previous role. We automated monitoring of over 400 security policies as code. The real shift wasn't the automation itself. It was the decision to measure compliance continuously rather than waiting for an incident to reveal our posture. We stopped asking "are we secure?" after something broke and started asking "are we within bounds?" every hour. That approach reduced cloud risk by 25% in six months and eliminated 48 hours of configuration-related downtime from the prior year.
The same principle applies to agents. Security Boundary Adherence captures four dimensions:
Permission scope violations. Does the agent attempt actions outside its granted scope?
Tool boundary compliance. Does the agent use only designated tools for each task?
Data access compliance. Does the agent access only authorized data sources?
Escalation compliance. Does the agent escalate when it should, rather than attempting unauthorized actions?
This metric is introduced here. The full architecture for achieving and enforcing Security Boundary Adherence is developed in Securing Agentic Systems (Book 2). Most teams will need to build the permission infrastructure (machine-readable permission sets, action logging, boundary definitions) before they can measure against it. That investment is the prerequisite. But you can start by defining the boundaries, even before you automate their enforcement. And treat the telemetry itself as security-relevant data, because correction rates and boundary violations that inform governance decisions become targets worth protecting.
If you aren't measuring security boundary adherence, you're trusting your agents the way early DevOps trusted its pipelines. And we all learned how that ended.
Practical measurement: Log every agent action against its granted permission set. Calculate the percentage of tasks completed with zero boundary violations. Flag and categorize any violations by type (scope, tool, data, escalation).
Benchmarking: What "Elite" Looks Like
DORA defined performance tiers that gave teams a shared vocabulary for where they stood. The 2025 report moved from those tiers to team archetypes, but the tiered model remains useful for initial adoption because it gives teams a clear direction of travel. AURA needs the same benchmarking language.
The tiers below are directional estimates, extrapolated from DORA's tiering methodology and calibrated against patterns I have observed across agentic teams. They are starting points for conversation, not empirical thresholds.
| Metric | Getting Started | Practicing | Proficient | Elite |
|---|---|---|---|---|
| Intent-to-Implementation | Days | Hours | < 1 hour | Minutes (with verification) |
| Token Efficiency | < 50% useful output | 50-70% | 70-85% | 85%+ |
| Agent Correction Rate | > 40% (any tier) | 20-40% | 10-20% (mostly Tier 1) | < 10% (Tier 1 only) |
| Context Continuity | No persistent artifacts | Some artifacts, manual | Systematic artifacts, loaded | Automated, measured, current |
| Security Boundary | Unmeasured | Monitored | Enforced | Adaptive (self-correcting within auditable bounds) |
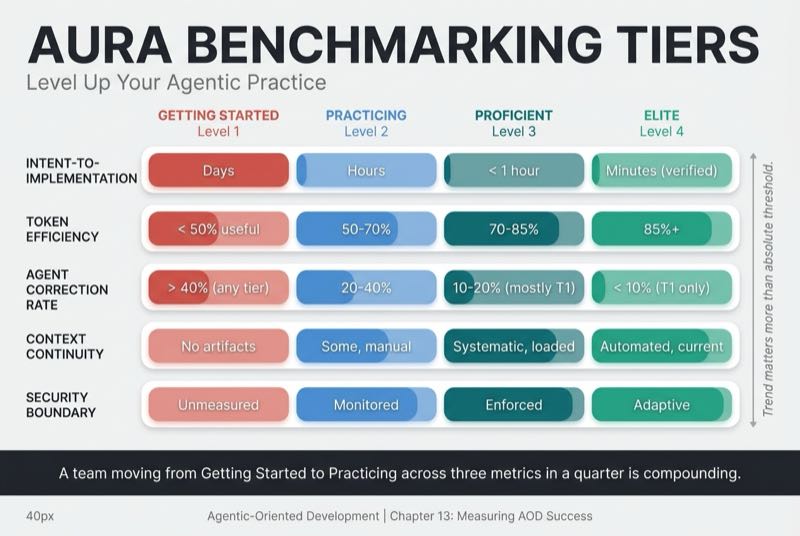
Every organization will calibrate to their context. The value is in tracking trend over time, not in hitting absolute thresholds. A team that moves from "Getting Started" to "Practicing" across three metrics in a quarter is compounding. A team stuck at "Getting Started" for six months needs a different intervention.
The tiers also map to the Agentic Maturity Model from Chapter 6. Getting Started maps roughly to Levels 1-2 (Vibe Coder and Prompt Engineer). Practicing maps to Level 3 (Context Engineer). Proficient and Elite map to Level 4 (Agentic Engineer). The measurement framework and the maturity model reinforce each other.
Decision-Relevant Measurement
Benchmarks give you a vocabulary for where you stand. The harder question is what you do with the numbers once you have them.
Every AURA metric should inform a specific decision. If it doesn't change what you do next, stop tracking it.
Intent-to-Implementation Time informs shipping decisions. "Can we ship this feature by Thursday?"
Token Efficiency Ratio informs infrastructure decisions. "Should we invest in better context architecture?"
Agent Correction Rate informs trust decisions. "Is this agent reliable enough for production use?"
Context Continuity Score informs staffing decisions. "Can a new team member onboard to this codebase by Monday?"
Security Boundary Adherence informs governance decisions. "Should we grant this agent access to production data?"
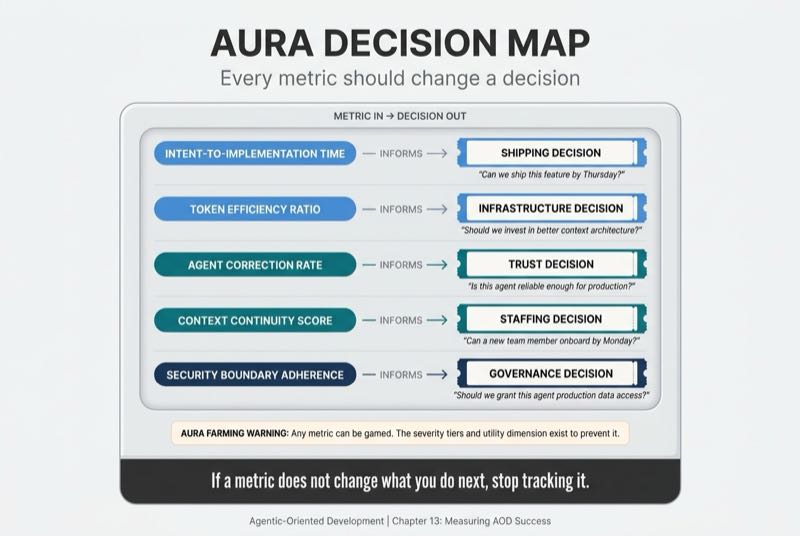
One warning. Any metric can be gamed. I call this AURA farming, and I want to name it before teams discover it on their own.
Teams will optimize for the numbers. That's Goodhart's Law (the tendency for a measure to lose its value once it becomes a target). The severity tiers in Agent Correction Rate exist precisely to prevent gaming. Fixing only cosmetic issues to drive the overall rate down doesn't work when Tier 3 and 4 corrections are weighted heavily. Context Continuity's utility dimension prevents creating artifacts nobody reads. You can't game utility. The metric checks whether agents actually load and use your knowledge artifacts.
The right approach is bottom-up. Don't start by deploying all five metrics. Start with the one that hurts most. If your teams are spending hours correcting agent output, start with Agent Correction Rate. If knowledge evaporates between sessions, start with Context Continuity Score. Let metrics emerge from failure patterns, not from a top-down mandate.
Why This Matters Now
The DORA research program transformed DevOps from "we think we're doing well" to "here's the data." Before DORA, DevOps teams argued about whether their process was working. After DORA, they measured it. The same transformation needs to happen for agentic development.
The 2025 DORA report found something that should concern every team adopting AI. Higher AI adoption correlates with increased throughput but also increased instability. Teams shipping faster with AI are also shipping less reliably. That finding alone validates why AURA separates throughput from quality from governance. Speed without stability is not progress.
Part III shifts from skills to architecture. Chapter 14 presents the Agent System Topology, the full stack from user to orchestrator to agent to tool. Think of it as the "class diagram" for agentic development. The topology and protocol patterns in Part III operate within measurable boundaries. AURA tells you whether those boundaries are holding.
The teams that measure will compound. The teams that don't will plateau.
DORA measures the pipeline. AURA measures the practitioner. You need both.
We measured our way from 180-day deployments to 14-day deployments at that enterprise platform. We didn't guess. We didn't hope. We measured. AURA gives agentic teams the same capability. Five metrics. Three categories. One framework for knowing whether your agentic practice is actually working or just moving fast.
From 180-day cycles to 14-day cycles, we never stopped measuring. The metrics changed because the work changed. Your agents deserve the same discipline.